The gap in ultraviolet cartography
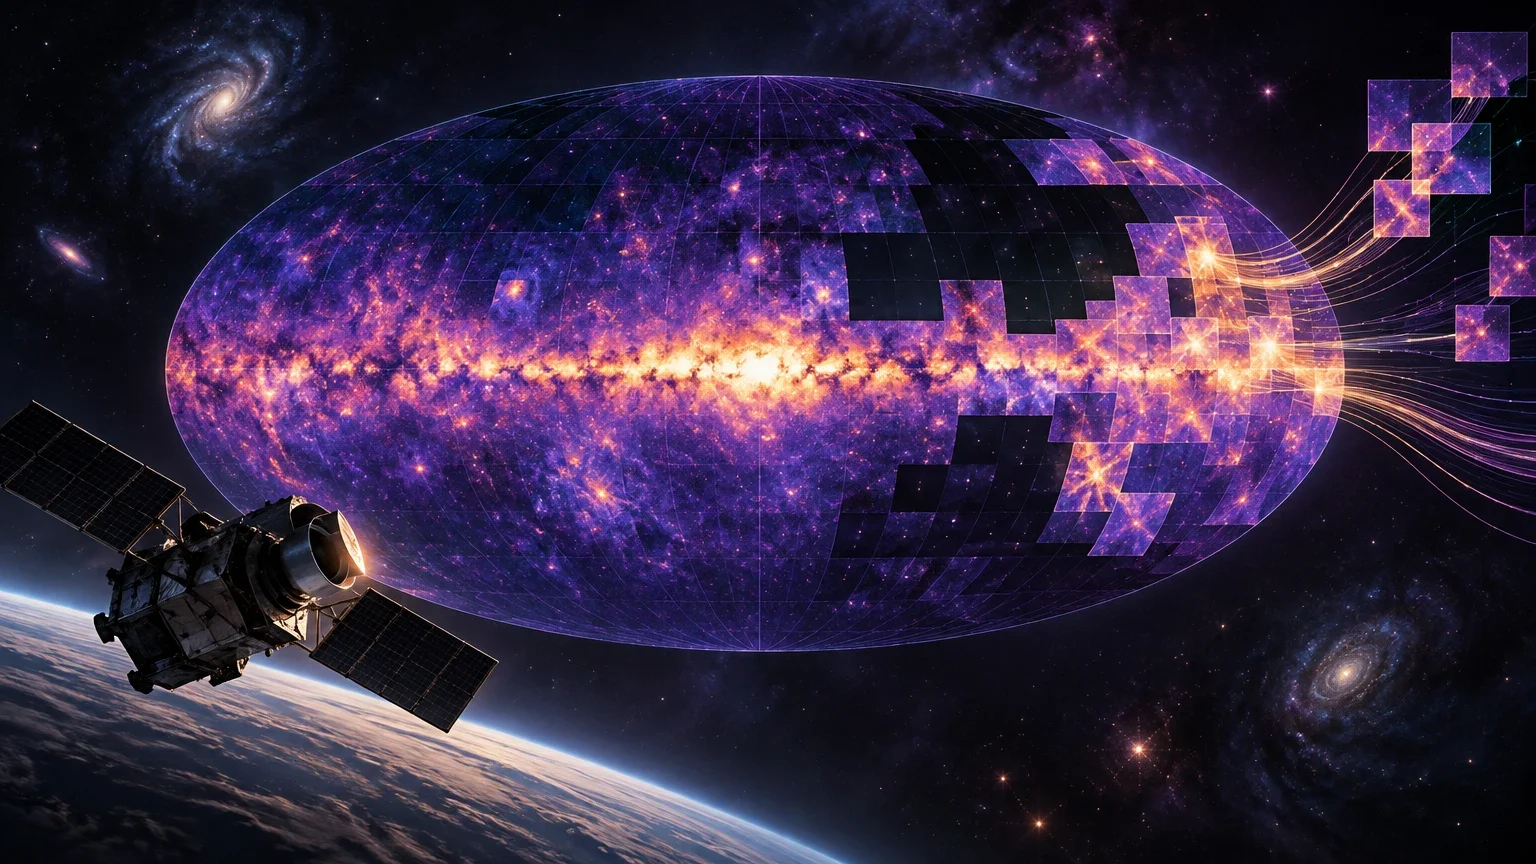
Ultraviolet light is absorbed by Earth's ozone layer, forcing these observations to be conducted from space. For decades, space telescopes have photographed parts of the sky in this band, but never completely. The largest volume of data comes from NASA's GALEX mission, which operated between 2003 and 2013 and captured approximately 38,000 images, covering about two-thirds of the sky.
GALEX deliberately omitted the plane of the Milky Way and other regions with high densities of bright stars to avoid damaging its detectors. Additionally, its far-ultraviolet detector ceased functioning before its near-ultraviolet counterpart. Later missions such as NASA's Swift and South Korea's FIMS/SPEAR added data, but when combined, the sky still presented large gaps, especially in the central third of the galactic disk.
Space mission coverage in ultraviolet
Summary of each mission's contribution to the final map.
| Mission | Agency | Period | Approximate coverage |
|---|---|---|---|
| GALEX | NASA | 2003-2013 | ~2/3 of the sky (38,000 images) |
| Swift-UVOT | NASA | 2004-present | Specific zones |
| FIMS/SPEAR | KASI (Korea) | 2013-present | Far-UV references |
| Gaia | ESA | 2014-present | Visible light (119M stars) |
The role of Claude Science in processing
Brice Ménard, an astrophysicist at Johns Hopkins University and a researcher at Anthropic, tasked Claude Science with gathering, calibrating, and merging all available ultraviolet data. The platform coordinated a team of AI agents that downloaded public datasets, removed artifacts such as bright star halos, and unified the measurement scales of different instruments.
The process was not entirely automatic. Ménard provided high-level instructions and reviewed intermediate results. The agents worked autonomously for hours on repetitive tasks, such as cross-calibration between telescopes and correction of residual atmospheric backgrounds, while the researcher focused on the scientific direction of the project.
AI agents' workflow
Key steps executed by Claude Science agents.
- 01Search and download of public UV surveys (GALEX, Swift, etc.).
- 02Artifact cleaning: removal of stellar halos and atmospheric noise.
- 03Cross-calibration: unification of resolutions and coordinate systems.
- 04Data fusion into a continuous map.
- 05Application of inpainting to fill zones without direct observation.
Filling gaps via inpainting
To cover the third of the sky without direct ultraviolet data, a machine learning technique called inpainting was used. The model learned the correlations between ultraviolet brightness and other wavelengths (visible, infrared, and radio) in the already-observed regions. It then applied these statistical relationships to estimate ultraviolet brightness in the empty zones, point by point.
It is crucial to distinguish that these areas are not new observations, but predictions based on existing data. The final map labels each pixel as 'measured' or 'predicted' and includes uncertainty estimates, allowing users to know which part of the image comes from real photons and which part from statistical models.
Validation and error correction
To evaluate accuracy, Ménard asked Claude to deliberately hide parts of regions with known data and reconstruct them. After several rounds of adjustment, the predictions deviated by an average of 10% from real measurements, a difference almost imperceptible visually. However, technical documentation nuances that in some reconstructed regions, errors can reach 12-14%.
A revealing incident occurred when Ménard detected faint circles in the map, caused by residual atmospheric glow from GALEX that had not been completely removed. Although two automatic reviews by other agents did not detect it, human intervention allowed the agents to trace the origin and correct the 38,000 observations within hours, eliminating the artifacts.
Implications and limits of the project
The map, which includes ultraviolet light estimates for over 100 million Gaia stars, is presented as an educational and research tool. It allows visualizing structures such as dust clouds illuminated by young stars and supernova remnants in a continuous view of the Milky Way.
However, the project has not yet undergone formal peer review. The claim of being the 'first complete map' refers to continuous coverage, not direct observation of every point. AI has proven useful for laborious data engineering tasks, but it does not replace independent scientific validation nor guarantee the detection of new objects in predicted zones.
Limits of the ultraviolet map
Considerations when using the map for research.
| Aspect | Detail |
|---|---|
| Peer review | Pending at the time of publication |
| Predicted zones | Not valid for announcing new discoveries |
| Uncertainty | Varies between 5% (measured) and 14% (predicted) |
| License | Data CC BY 4.0, Code MIT |
Open questions
- The exact error figure in predicted zones varies between 10% (outreach narrative) and 12-14% (technical documentation), depending on the region and evaluation method.
- The peer-review status of the scientific work remains pending, so the methodology has not been formally validated by the astronomical community.
- The complete availability of data and code files for independent reuse was in preparation at the time of publication, limiting immediate replication.
Keep exploring
Sources consulted
Corrections and transparency
If you spot incorrect or outdated information, send us a correction with the page and source we should review.
Submit a correction